
Overview
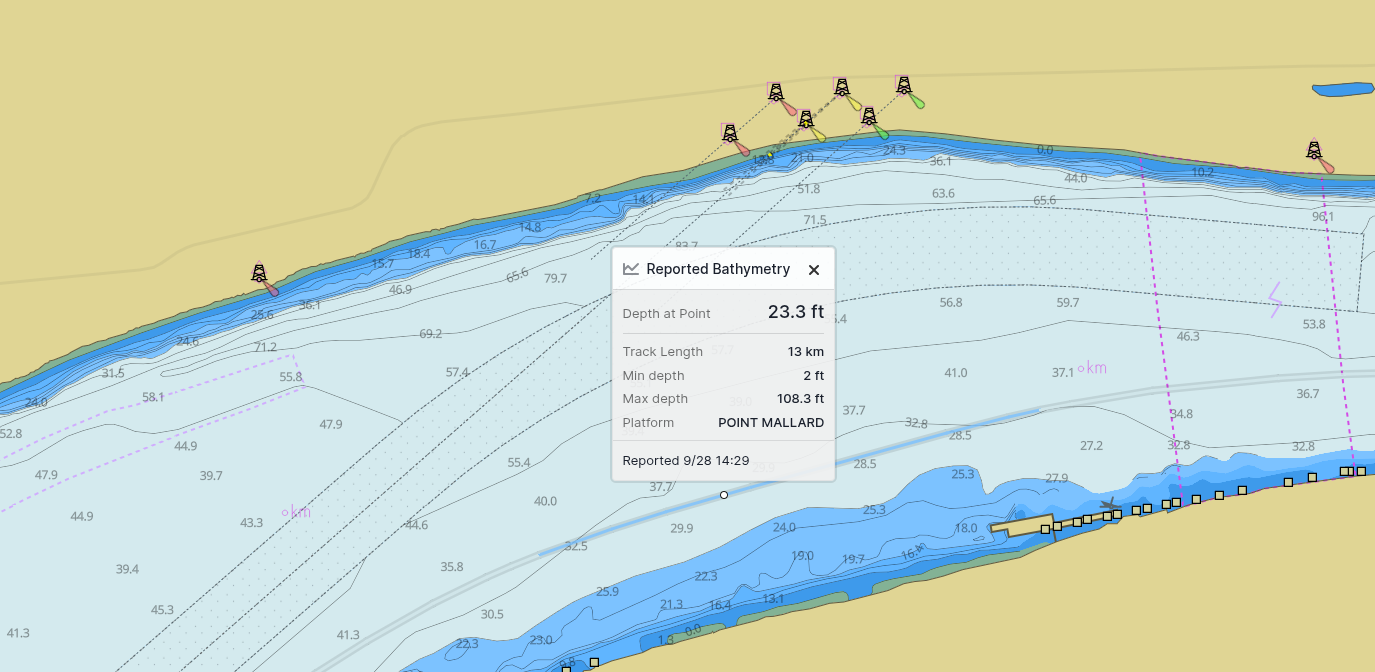
Official charts can be out of date in changing harbors, rivers, and creeks which are not mapped often. Crowdsourced reports help to fill those gaps and help make navigation safer.
The Vector Charts Crowdsourced Data program gives you a managed API to submit and display user reports in your application.
How it works
- Submit hazard and depth reports from your app via the Crowdsourced Data API.
- We process the data and make it available back to your users (and the hydrographic community).
- Show crowdsourced layers on any Vector Charts map using our API.
Submission and display are both opt-in. Try a live example in the Vector Charts Demo App.
Types of data
Hazard reports
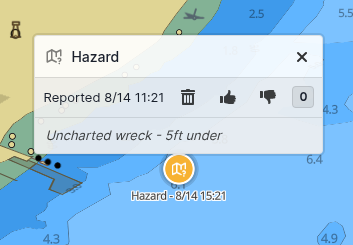
The Hazard Report API lets users report ephemeral hazards such as debris, wrecks, or marine wildlife. Reports are displayed in Vector Charts as map points and can be upvoted or downvoted.
Bathymetry tracks
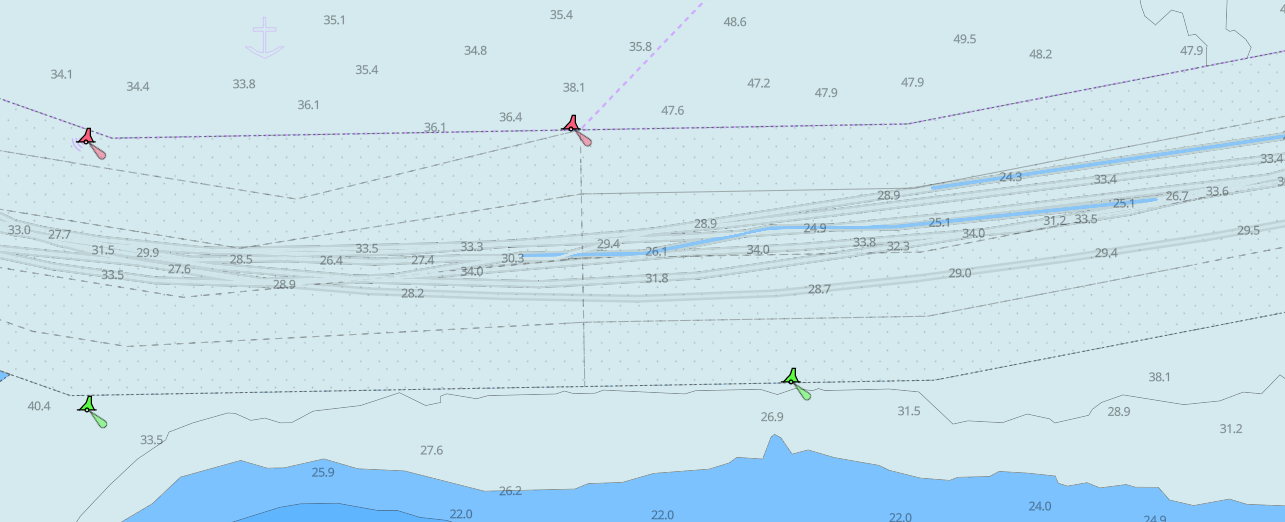
The Bathymetry Report API accepts position and depth from sonar or similar devices. Soundings are displayed in Vector Charts as depth-shaded tracks.
Displaying crowdsourced data on the map
Enable built-in layers with showUserReports=true on the Get Vector Style request:
const map = new mapboxgl.Map({
    style: "https://api.vectorcharts.com
/api/v1/styles/base.json?token=<token>&showUserReports=true"
});
This adds hazard point layers and bathymetry track layers. You can also use the REST and tile endpoints directly (see the Hazard Report API and Bathymetry Report API).
Getting started
- Authenticate with a Vector Charts API token. See Authentication.
- Submit hazard reports and/or depth soundings through the APIs.
We Want Your Feedback
Crowdsourced Data is an evolving feature set. If you need any help, or have suggestions for how to improve it, please Contact us.