
Overview
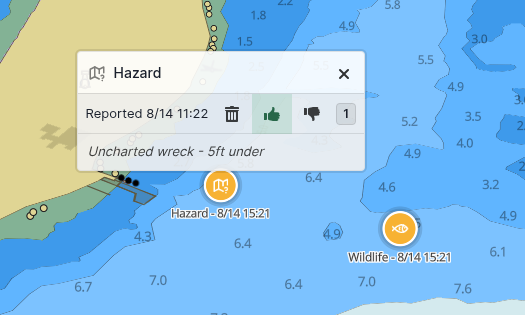
The User Report API allows your end users to share location-based feedback (for example uncharted hazards, accidents, weather, and wildlife).
Vector Charts runs the infrastructure, allowing you to build rich user-feedback into your application without needing backend infrastructure.
For an example of user reports in action, try out user reports in our Vector Charts Demo App.
Types of reports
Currently, the User Reports API supports point (latitude/longitude) reports. Each report can be tagged with a category and optional description.
Report reputation
We expose two ways of evaluating report reputation and relevance:
- Time: Older reports eventually expire. On Vector Charts OEM, this value is configurable.
- User Votes: We expose an API to upvote or downvote user reports, which you can embed in your application.
Displaying reports on the map
Enable the built-in user-report layers by adding showUserReports=true to the Get Vector Style request:
const map = new mapboxgl.Map({
    style: "https://api.vectorcharts.com
/api/v1/styles/base.json?token=<token>&showUserReports=true"
});
When enabled, the style will display icons & text indicators for user reports as a map overlay.
Querying reports directly
If you prefer not to use the built-in style layers, or need reports outside a map viewport, query the REST and tile endpoints directly:
- List Reports - paginated JSON feed of all reports
- Get Reports (MVT) - Mapbox vector tiles with reports as point features
- Get Reports (GeoJSON) - GeoJSON tiles with reports as point features
Authentication
All user report endpoints are authenticated similarly to other API endpoints. To authenticate, provide a valid API token, either as a header or query parameter:
Authorization: Bearer <token>header?token=<token>query parameter
We Want Your Feedback
User Reports are a new feature. If you need any help, or have suggestions for how to improve the feature, please Contact us.